Disclaimer: Any views expressed by individuals and organisations are their own and do not in any way represent the views of The Heritage Portal. If you find any mistakes or historical inaccuracies, please contact the editor.
Maps are designed for a variety of purposes; they may reflect our history, visual perspective of earth, seas and skies; scientific and technological developments and even our social history and culture. They are, therefore, important heritage artefacts.
In 1755 a small map by the French astronomer, Nicolas-Louis de Lacaille (1713-1762), dramatically changed the representation of the shape of the coast of the Cape (of Good Hope) on printed maps.
Background
Lacaille is best known for his pioneering charting of the southern skies in 1752 and 1753, from his observatory in Strand Street, Cape Town. After completing this project, he had to wait some time before a French ship could take him to Mauritius, his next destination. So, he set about the first quantitative experiment in southern Africa. He tested an hypothesis on the symmetry of the shape of Earth; this required a trigonometric method that involved accurate astronomical determination of longitude and latitude, careful measurement of the length of a baseline using calibrated rods and calculation so he could determine the terrestrial distance of one degree of latitude at the Cape. His measurements were accurate, and his trigonometry correct. The results were a surprise, however: the distance was longer than expected. So, he remeasured the length of his baseline and checked his calculations. He could find no error in his measurements or calculations, so he came to the ineluctable conclusion that the southern hemisphere bulged relative to the northern hemisphere: a pear-shaped Earth!
Almost a century later, Thomas Maclear took heed of a hint from George Everest, the famous surveyor in the Himalayas and repeated Lacaille’s experiment. Maclear concluded that Everest was correct: Lacaille had omitted the effect of gravity between masses. The mountains near his measurement sites had attracted the plumb bob he used to ensure the perpendicular. The effect was small but sufficient to cause an error.
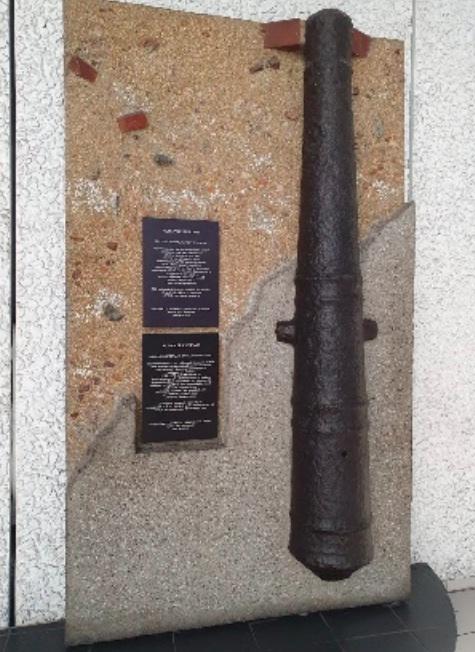
One of the cannon barrels that Maclear used to identify the ends of the baseline of his geodetic triangles, on the Parade. is in the Golden Acre Shopping Centre beneath which it was found during excavations during the construction of the centre.
Evolving shape of the Cape
The VOC settlement initially expanded slowly for about one century: in about 1750 the approximate eastern extent of settlement was a diagonal line between Cape Agulhas in the southeast and St. Helena Bay in the northwest. The shape of the coastal outline of this section of the Cape, depicted on early maps (1605-1795), conveniently can be represented by four influential maps:
- The Van Spilbergen map, produced after Joris van Spilbergen’s 1601 voyage to Ceylon (i.e. Sri Lanka). (1605)
- The Hondius III map, in the year Van Riebeeck established the VOC settlement at the Cape. (1652)
- John Seller’s ‘English’ map derived from Dutch manuscript maps. (1675)
- The Lacaille map that depicted his geodetic survey, and his sea chart. (1755 and c. 1765)
- Delarochette’s derivative map published after the Battle of Muizenberg. (1795).
The Van Spilbergen map
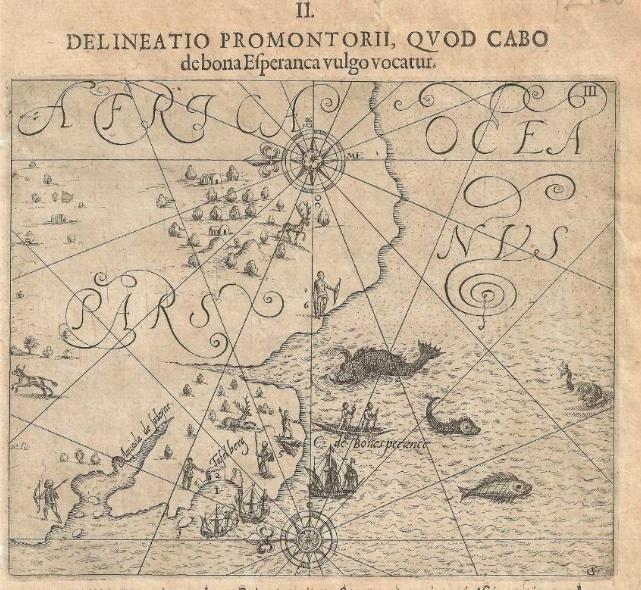
Van Spilbergen’s 1605 map of the Cape of Good Hope is Africae Pars [Part of Africa], which has north orientated towards the left. The headline: Delineato Promontorii, Quod Cabo de bona Esperanca vulgo vocatur explains which part of Africa: ‘A map of the promontory, commonly known as the Cape of Good Hope’. The edition of the map illustrated here is from Theodore de Bry’s ‘Petit Voyages’ (Frankfurt: Wolfgang Richter, 1612). This is the first map dedicated to only the Cape of Good Hope. It was included in van Spilbergen’s journal (first published in 1605) by Floris Balthazar and in subsequent republications of the map by the De Bry brothers.
The van Spilbergen Map
Joris van Spilbergen’s small fleet, the Ram, Schaap, and Lam, had visited the Cape of Good Hope in 1601, while en route to Ceylon, where van Spilbergen negotiated trade in spices with the King of Kandy (within Ceylon).
False Bay is the unnamed bay with the entrance ‘guarded by a sea monster’ to the east of (above) C. de Bonesperance (Cape of Good Hope). Saldana Bay is Aguada de Saldeïjne to the north (left) of Table Bay, the name assigned by van Spilbergen to the bay below and northwest of Table Mountain.
Roland Raven-Hart provided an English translation of van Spilbergen’s journal on the Cape (R Raven-Hart. ‘Before van Riebeeck’. Cape Town: Struik,1967, pages 25-29). Van Spilbergen explained the numbers indicated on the map: 1. Table Bay; 2. Table Mountain 'which is seen 9 or 10 miles at sea' (a Dutch mile was about 5.7 km); 3. Isla d'Elizabeth (now Dassen Island); 4. Isla de Cornelia (now Robben Island); 5. Caep de bon Esperance (Cape of Good Hope); 6. 'These inhabitants have a clucking speech like turkeys (Khoekhoe, formerly known as Hottentot), and there are many harts and hinds (male and female deer) here.'
Hondius III map
Jodocus Hondius III, AKA Joost de Hondt the third (1622-1655), was the grandson of the eponymous founder of the famous family of mapmakers who operated from The Watchful Dog, their premises near the Amsterdam stock exchange.
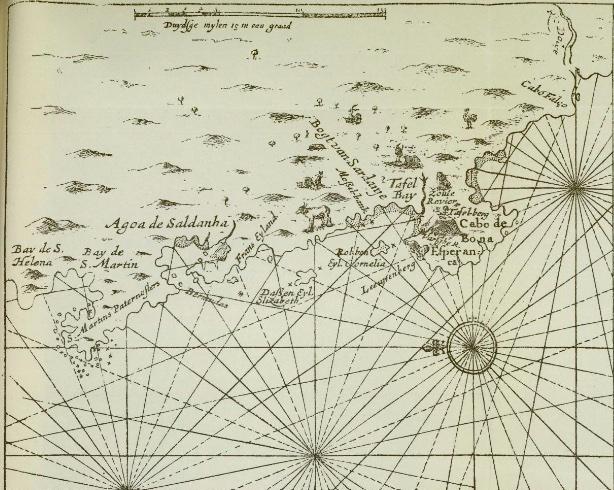
In 1652, Hondius III published a rare booklet: ‘Klare Besgryving Van Cabo de Bona Esperanca’ (A Clear Description of the Cape of Good Hope). The booklet provided ‘a short, clear description of the land about the Cape of Good Hope which is the boundary between the East and West Indies’. The booklet also included three crude illustrations and a map: ‘Pas-kaarte van de zuyd-west-kust van Africa; van Cabo Negro tot beoosten Cabo de Bona Esperanca’ (Chart of the south-west coast of Africa; from Cape Negro to the east of the Cape of Good Hope). An untitled inset map, illustrated below, is at the top left: it is a map of the Cape of Good Hope. The Klare Besgryving and accompanying inset chart fulfilled a public need for information in the Netherlands after Van Riebeeck had led the team that established the VOC at the cape of Good Hope.
Hondius III map
The inset map has the same orientation as the Spielbergen map and covers a similar geographical area… and also includes images of ‘harts and hinds’, but not people. The shape of the Cape is markedly improved and more recognisable. Nevertheless, the shape is still crude; Hondius did not visit the Cape but had access to the records of the VOC. Even so, accurate determination of longitude at sea was near impossible in the 17th century and so all maps were ‘crude’ by today’s standards. The names of the islands assigned by Hondius are taken from the Van Spilbergen map.
Of particular interest is the Bogt van Sardanje (Bight of Saldana) which is an indent in Table Bay (between today’s Milnerton and Table View), and the crosses to their north, one of which represents the location of the wreck of the Haarlem, which had foundered in 1647. It was the report of the survivors that catalysed the VOC’s decision to establish a provisioning station in 1652 on the southern shore of Table Bay (the site of the Haarlem wreck is currently the subject of archaeological investigation).
The Seller map
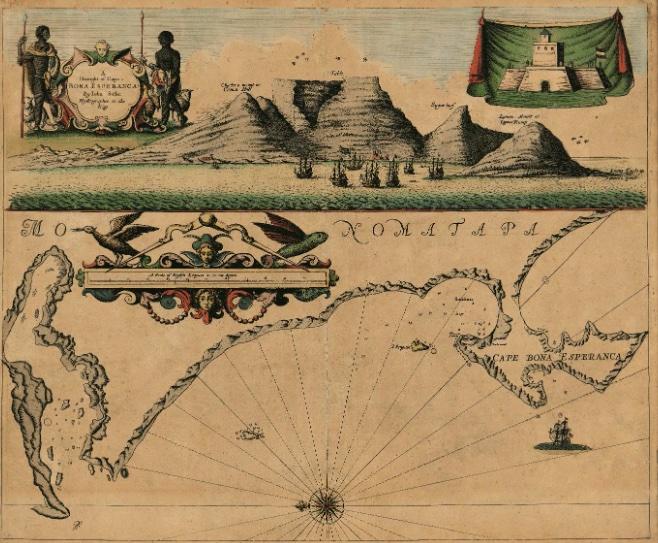
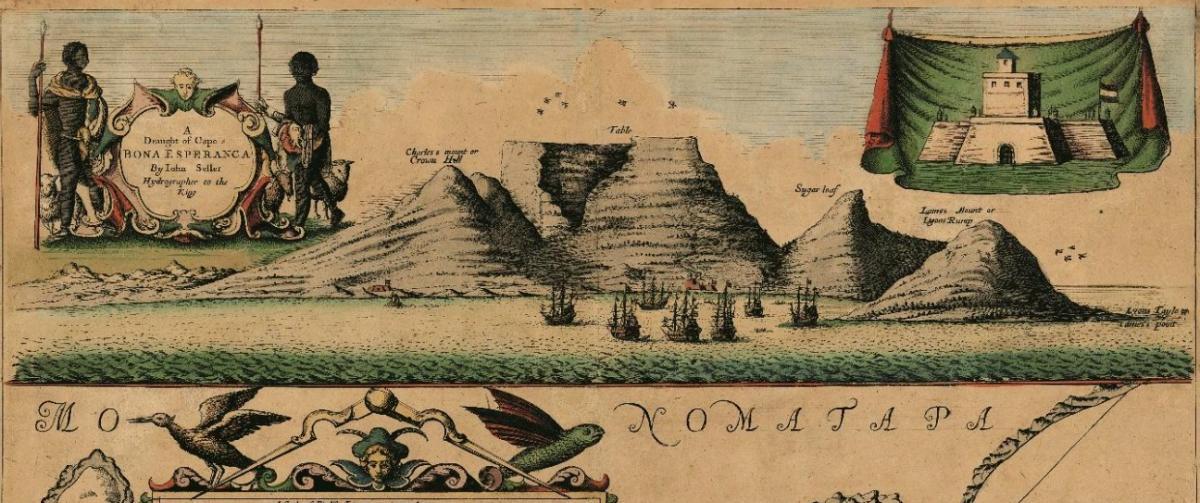
This attractive chart of The Cape was published by John Seller in 1675 in his ‘Atlas Maritimus' and in the third book of ‘The English Pilot’. The English East India Company (EEIC) and the public had an interest in the Cape because of the sea route to trade in the East Indies. This interest persisted despite the decision of King James I of England not to take possession of the Cape: Andrew Shillinge and Humphrey Fitzhenry, ships’ Captains in the English East India Company, had offered it to him after they had claimed possession of the land in 1620. With the King not interested, the Dutch arrived on the sixth of April 1652 at the shore of Saldinia Bay (i.e. Table Bay), where they soon erected a fort, which is illustrated at the top right in the vignette above the Seller map.
Seller Map
The EEIC was in competition with the Dutch VOC and, therefore, safe navigation of its ships to the East was of great importance. Nevertheless, the EEIC did not produce any accurate sea charts of the route, while the Dutch kept their charts secret. There is cartographic irony in Seller’s ‘English’ chart. Its source was Dutch! The primary source of the shape of the chart was ‘Kaart van Saldanhabaai tot de Falsbaai’, two similar manuscript charts drawn in the 1660s by Caspar van Weede and Johannes Vingboons in the Netherlands.
The chart is notable for its flawed shaped; depiction of the prospect of the vlek (hamlet) and amphitheatre of mountains; illustration of the VOC’s old wood and mud fort with its Dutch flag a loft; and for its Sardinia Bay, the outdated name for Table Bay, but first naming of Green Point on a printed map. The overall shape of the coastline was reproduced in numerous English and French charts for almost a century.
Lacaille map and sea chart
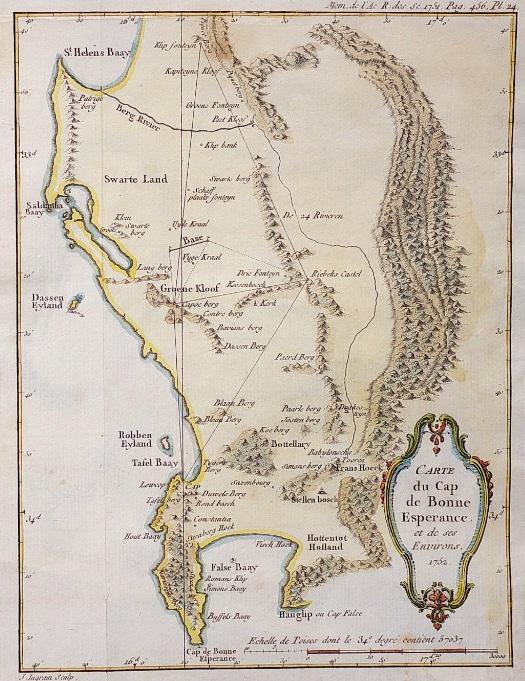
In 1755, Lacaille reported his findings on the shape of the earth to the French Academy of Sciences. His article included a small map of the Cape of Good Hope, probably to provide geographical context and orientation – he had surveyed only the triangles and not the Cape coastline. Although it was not his intention, the small map proved to be both important and influential. It dramatically changed the apparent shape of the coastal outline of the Cape of Good Hope and led to numerous subsequent scientific surveys of the coast. These later surveys took advantage of the development of the marine chronometer, which enabled the accurate determination of longitude. Lacaille had had to use powerful, heavy astronomical telescopes which were inappropriate for coastal surveys.
Lacaille Map
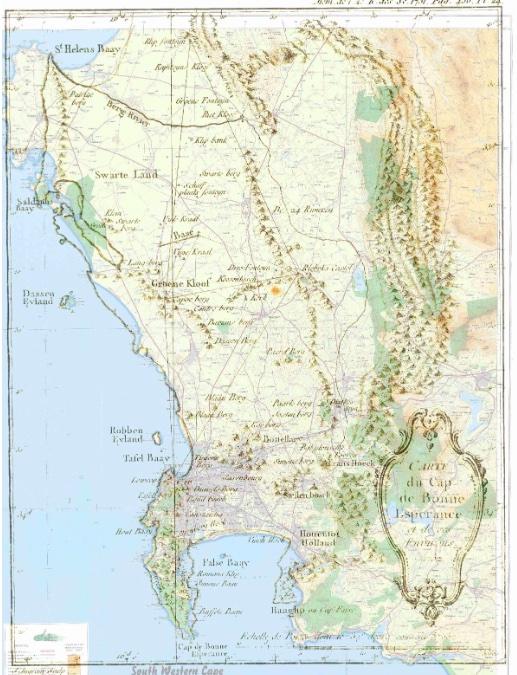
Unlike the prior maps, Lacaille’s map is orientated with north on top. As is to be expected, it displays the triangles he used in his determination of the shape of Earth. The shape of the Cape coastline is now recognisable today, despite three significant anomalies: the coast between St Helena and Saldanha Bays does not bulge sufficiently westwards; Saldanha Bay is twice as long as it should be (it extends all the way to Yzerfontein, which is too far south); and the eastern shoreline of False Bay does not extend sufficiently south: Cape Hanglip (now Hangklip) should be a tad south of Cape Point. Lacaille’s manuscript map is in the archives in Cape Town – it has the same errors. Although I am sure he received assistance from some of the VOC surveyors, I have been unable to find any VOC or other examples of Lacaille’s outline.
In the illustration above, Lacaille’s map is overlaid on a 205 000:1 map of the regions (thanks to the South African Directorate for Geospatial Information, for preparing this figure).
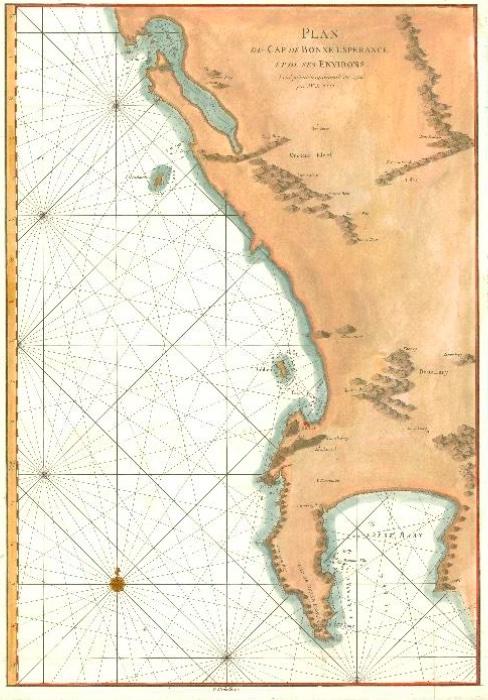
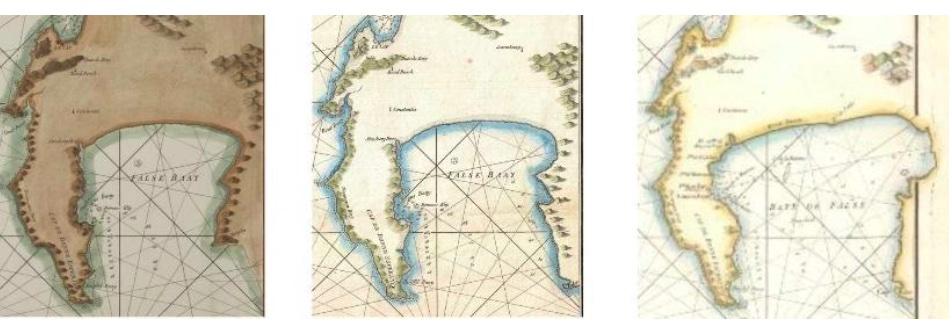
Lacaille was also instrumental in producing a much more accurate sea chart of the Cape of Good Hope that was published in c. 1765: ‘Plan du Cap de Bonne Esperance et de ses environs’. Although more accurate than earlier sea charts, it repeated the above errors in Lacaille’s terrestrial map. However, the Hanglip error was corrected in 1775 in a new edition of the chart published in ‘Neptune Oriental’, an atlas and navigation guide published by Jean-Baptiste Aprés de Mannevillette. He was the ship’s captain and hydrographer who took Lacaille to the Cape in 1751 and with whom he made astronomical observations and discussed mapping of the region.
Plan du Cap de Bonne Esperance et de ses environs
In 1781 Mannevillette’s made further changes to False Bay, to the north-east corner (now Gordon’s Bay), in the posthumously published ‘Supplement to Neptune Oriental’. This change was made on the basis of a surveyed chart he had received in late 1775 from his English colleague and friend, Alexander Dalrymple. Dalrymple’s survey of False Bay was notable for a few reasons. It was meticulous and made use of an Arnold pocket chronometer, which allowed for accurate determination of longitude – therefore, it was more accurate than prior charts.
The evolution of the shape of False Bay on Plan du Cap
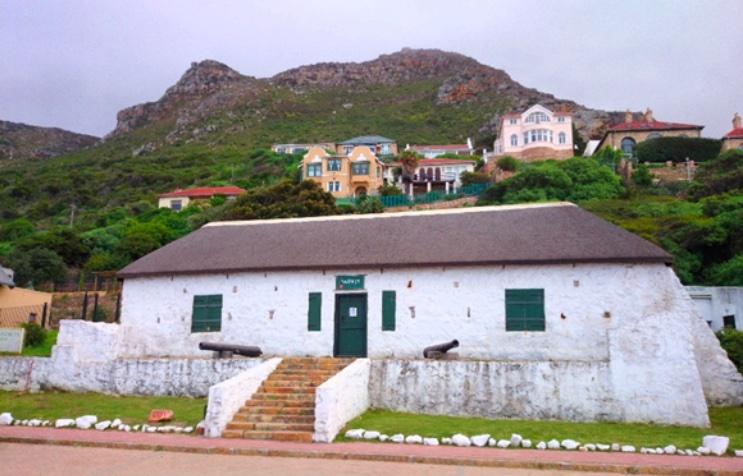
Dalrymple’s survey is also remarkable because it was conducted during Dutch rule, with the VOC’s consent. Ironically, it may well have been used by the English in the 1795 Battle of Muizenberg, during which an English cannonball hit Het Posthuys (in Muizenberg), one of the survey stations used by Dalrymple! Het Posthuys is now a provincial heritage site – the oldest colonial building after the Castle.
Het Posthuys
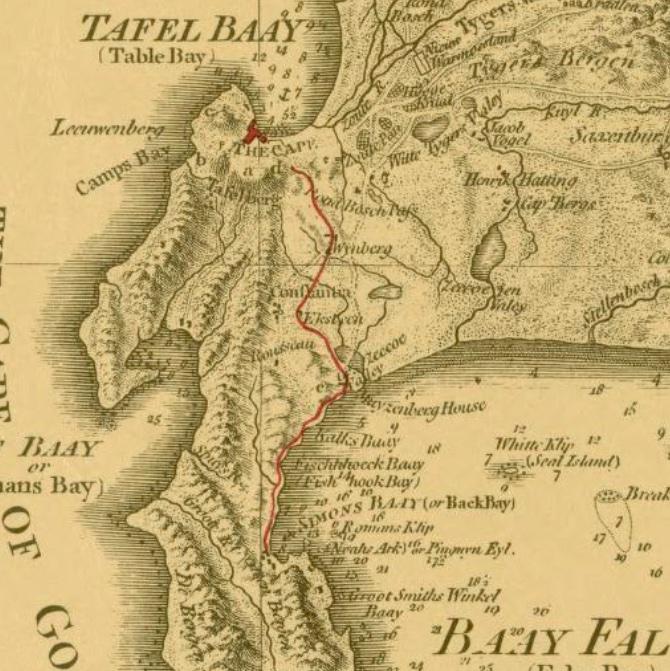
The route of the British soldiers from Simon’s Town to Cape Town, where they negotiated the capture of the Dutch Colony, is depicted on a 1795 derivative of Lacaille’s chart. This derivative map, the ‘Dutch Colony of the Cape of Good Hope’ was produced by Louis Stainslas Delarochette. A red line was drawn on only a few copies of the map, which also shows Muyzenberg House (i.e. Het Posthuys) that the victorious English the soldiers marched on their way to Cape Town (a treaty was signed at Rustenburg, now a junior school).
The map with red line
With the advent of the marine chronometer the British undertook numerous surveys of the coastline of the now much expanded Cape Colony, introducing new hydrographic detail and greater accuracy to the shape of the Cape introduced by Lacaille.
I am grateful to Jonathan and Gail Schrire for access to their collection of heritage maps of southern Africa, which includes editions of the maps illustrated in this article. (click here for more details about the collection)
The author explains Lacaille’s small map in more detail in this short video. The video records a surprise, unprepared interview conducted by James Findlay.
Selected articles by the author on maps of the Cape of Good Hope
- A mystery resolved. Lacaille’s map of the Cape of Good Hope. IMCoS Journal 2009; 119: 7 – 11
- De la Rochette’s map of the Cape of Good Hope. IMCoS Journal 2013; 132: 30-35.
- Seller’s Cape Bona Esperanca. Deliberate Dutch Disinformation? Maps in History; 2016; 56: 17 – 23.
- Nicolas-Louis de Lacaille: pioneer of scientific cartography in Southern Africa. Maps in History; January 2020; 66: 29 – 33
- Untangling the authors of the four states of Pan du Cap de Bonne Esperance. Maps in History; 2024; 78: 20-27.
Comments will load below. If for any reason none appear click here for some troubleshooting tips. If you would like to post a comment and need instructions click here.

